Control Your Weight 
Ellipse
How to read this graph ?
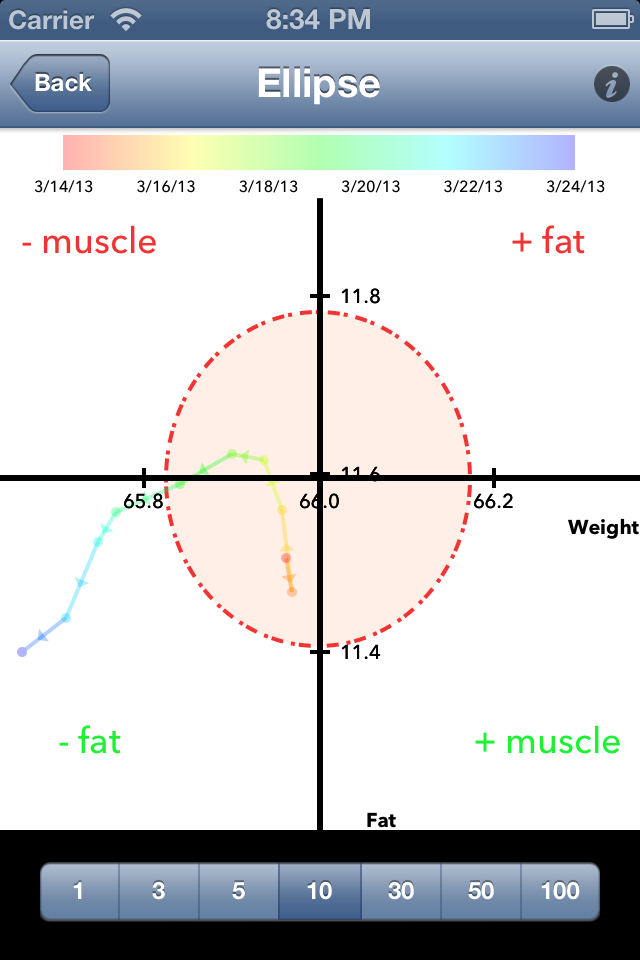
The Ellipse help you to understand how your weight and fat have evolved. Indeed, if you a sportman, an increase of your weight doesn't mean your fat has increased, it could also mean that you have increased your muscle mass.This graph represent the simultaneaous evolution of your weight and fat. The points are drawn chronologically and the color of the points represents the measure date.
The ellipse represents the stability zone. As long as, your last points is inside the ellise, it means your weight and fat are stable
When a point is outside the ellipse, it means your weight or fat have significativelly variated :
- It could be positive, your muscle mass has increased or you have lost fat mass.
- It could be negative, your have lost muscle mass or your fat mass has increased.
To know in which case you are, you only need to read in which sector your last point is.